Power BI dashboards
A clearer view starts with better reporting foundations.
A useful Power BI dashboard starts with business questions. Agree KPI definitions and reporting logic first, then shape the data model and report pages around the decisions your team needs to make.
Discuss your reporting process ↗When this is a good fit
For businesses that need a shared view of performance but currently reconcile conflicting figures or spend more time preparing a dashboard than using it.
Typical Power BI reporting views
- Executive performance overview
- Budget vs. actual
- Sales, margin and trends
- Inventory and working capital
- Performance by region, product or customer
- Operational KPIs and exceptions requiring attention
What the work includes
A practical scope, built around your process.
- 01
Agree the audience, decisions, metric definitions and reporting grain.
- 02
Prepare a structured data model and measures that follow the agreed business logic.
- 03
Design focused report pages, with maintainability, refresh, access and licensing requirements considered during scoping.
What this could look like
An illustrative workflow
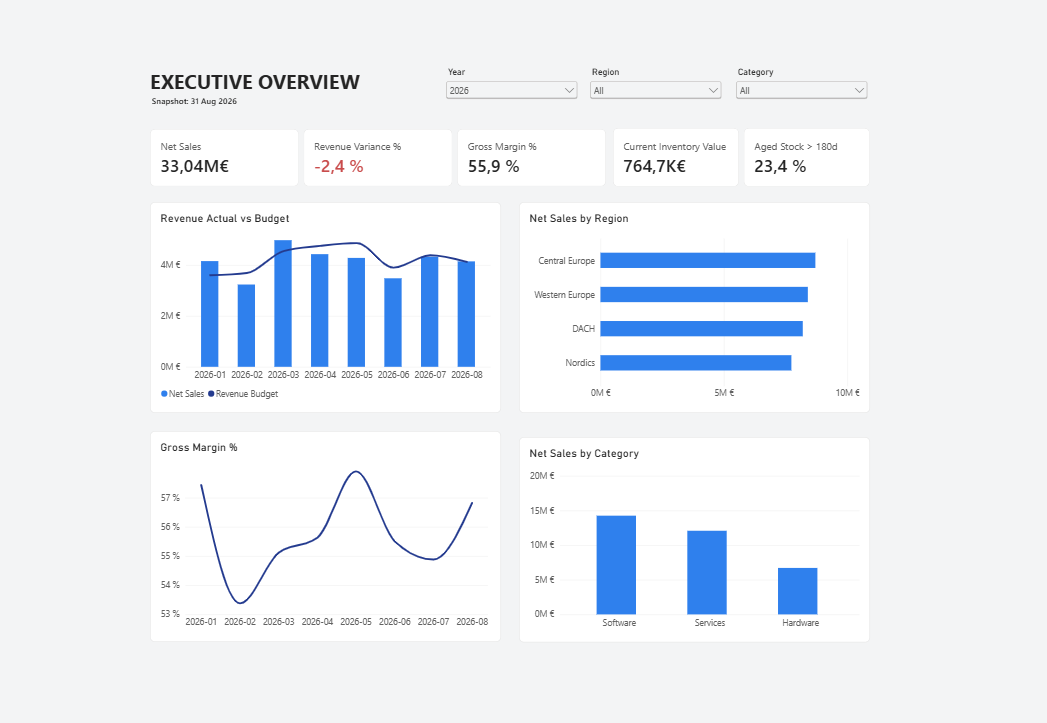
An illustrative executive overview connects sales, budget and margin. A separate inventory view helps explore aging stock and working capital. Each page serves a specific question instead of filling the screen with unrelated indicators.
- Source data
- Model & measures
- Report pages
- Review
- Publish & refresh
From process to perspective
Make the information useful.
How are sales tracking against budget? Where is margin changing? A connected reporting view helps you explore the questions behind the numbers.

What you take forward
A Power BI report, documented measure definitions and refresh guidance. Publishing, sharing, gateways and scheduled refresh depend on your Microsoft environment, access and licensing; they are agreed during scoping, not included in every project.
Start with your process
Which report would you stop rebuilding?
Tell Ralmay about a recurring report or manual process. Start with what happens today and where the work gets stuck.